Bedrock erosion
Note
Click here to download the full example code
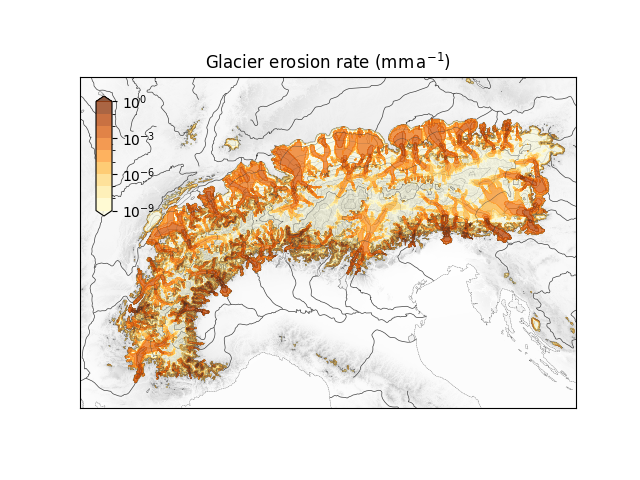
Bedrock erosion#
Plot a composite map including bedrock altitude, surface altitude contours, bedrock erosion computed from basal ice velocity, and geographic elements.
import matplotlib.pyplot as plt
import matplotlib.ticker
import hyoga

# initialize figure
ax = plt.subplot()
cax = plt.axes([0.15, 0.55, 0.025, 0.25])

# open demo data
with hyoga.open.example('pism.alps.out.2d.nc') as ds:

    # plot model output
    ds.hyoga.plot.bedrock_altitude(ax=ax, center=False)
    ds.hyoga.plot.surface_altitude_contours(ax=ax)
    ds.hyoga.plot.bedrock_erosion(
        ax=ax, cbar_ax=cax, levels=[10**i for i in range(-9, 1)],
        cbar_kwargs=dict(
            format=matplotlib.ticker.LogFormatterMathtext(),
            ticks=[10**i for i in range(-9, 1, 3)]))
    ds.hyoga.plot.ice_margin(ax=ax)

    # add coastline and rivers
    ds.hyoga.plot.natural_earth(ax=ax)

# set axes properties
cax.set_ylabel('')
ax.set_title(r'Glacier erosion rate (mm$\,$a$^{-1}$)')

# show
plt.show()
Total running time of the script: ( 0 minutes 5.325 seconds)