Surface contours
Note
Click here to download the full example code
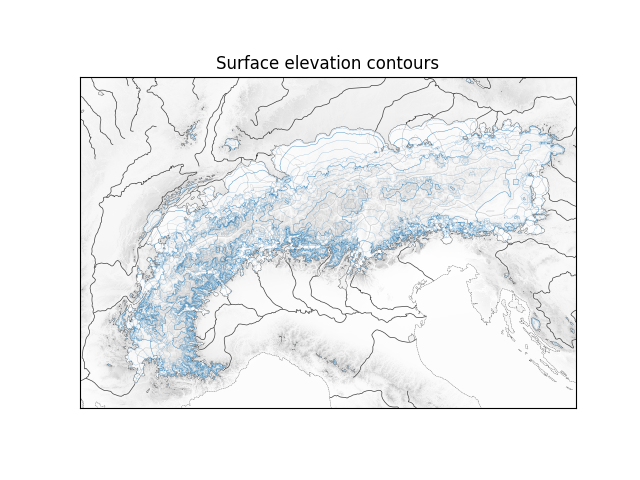
Surface contours#
Plot a composite map including bedrock altitude, a half-transparent ice mask, a surface altitude contour, and geographic elements.
downloading https://raw.githubusercontent.com/juseg/hyoga-data/main/pism/pism.alps.out.2d.nc...
downloading https://naturalearth.s3.amazonaws.com/10m_physical/ne_10m_coastline.zip...
downloading https://naturalearth.s3.amazonaws.com/10m_physical/ne_10m_rivers_lake_centerlines.zip...
downloading https://naturalearth.s3.amazonaws.com/10m_physical/ne_10m_rivers_australia.zip...
downloading https://naturalearth.s3.amazonaws.com/10m_physical/ne_10m_rivers_europe.zip...
downloading https://naturalearth.s3.amazonaws.com/10m_physical/ne_10m_rivers_north_america.zip...
downloading https://naturalearth.s3.amazonaws.com/10m_physical/ne_10m_lakes.zip...
downloading https://naturalearth.s3.amazonaws.com/10m_physical/ne_10m_lakes_australia.zip...
downloading https://naturalearth.s3.amazonaws.com/10m_physical/ne_10m_lakes_europe.zip...
downloading https://naturalearth.s3.amazonaws.com/10m_physical/ne_10m_lakes_north_america.zip...
import matplotlib.pyplot as plt
import hyoga

# open demo data
with hyoga.open.example('pism.alps.out.2d.nc') as ds:

    # plot model output
    ds.hyoga.plot.bedrock_altitude(center=False)
    ds.hyoga.plot.ice_margin(facecolor='w')
    ds.hyoga.plot.surface_altitude_contours(colors='tab:blue')

    # add coastline and rivers
    ax = ds.hyoga.plot.natural_earth()

# set title
ax.set_title(r'Surface elevation contours')

# show
plt.show()
Total running time of the script: ( 0 minutes 9.846 seconds)