Surface velocity
Note
Click here to download the full example code
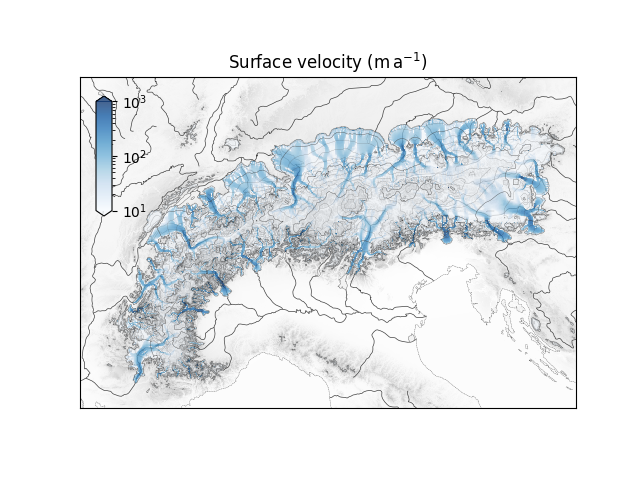
Surface velocity#
Plot a composite map including bedrock altitude, surface topography contours, a surface velocity map, and geographic elements.
import matplotlib.pyplot as plt
import hyoga

# initialize figure
ax = plt.subplot()
cax = plt.axes([0.15, 0.55, 0.025, 0.25])

# open demo data
with hyoga.open.example('pism.alps.out.2d.nc') as ds:

    # plot model output
    ds.hyoga.plot.bedrock_altitude(ax=ax, center=False)
    ds.hyoga.plot.surface_altitude_contours(ax=ax)
    ds.hyoga.plot.surface_velocity(ax=ax, cbar_ax=cax, vmin=1e1, vmax=1e3)
    ds.hyoga.plot.ice_margin(ax=ax)

    # add coastline and rivers
    ds.hyoga.plot.natural_earth(ax=ax)

# set axes properties
cax.set_ylabel('')
ax.set_title(r'Surface velocity (m$\,$a$^{-1}$)')

# show
plt.show()
Total running time of the script: ( 0 minutes 5.095 seconds)