Grid refinement
Note
Click here to download the full example code
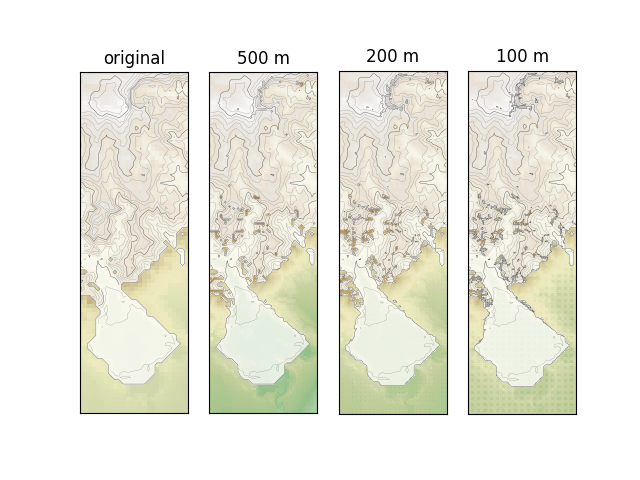
Grid refinement#
Demonstrate two-dimensional model output interpolation onto grids with increasing spatial resolution. The leftmost panel shows the original data with a spatial resolution of 1 km, and other panels show interpolated results.
import matplotlib.pyplot as plt
import hyoga

# initialize figure
fig, axes = plt.subplots(ncols=4)
resolutions = [500, 200, 100]

# open 100m resolution topography for edits
with hyoga.open.example('pism.alps.vis.refined.nc') as ds:
    topo = ds.hyoga.getvar('bedrock_altitude')
    topo = topo.sel(x=slice(402e3, 427e3))

# open demo data
with hyoga.open.example('pism.alps.out.2d.nc') as ds:
    ds = ds.hyoga.assign_isostasy(hyoga.open.example('pism.alps.in.boot.nc'))

    # plot original data
    ax = axes[0]
    ds.hyoga.plot.bedrock_altitude(ax=ax, cmap='Topographic', center=False)
    ds.hyoga.plot.surface_altitude_contours(ax=ax)
    ds.hyoga.plot.ice_margin(ax=ax, facecolor='w')
    ax.set_title('original')

    # plot interpolated results
    for ax, res in zip(axes[1:], resolutions):
        stride = int(res/100)
        interp = ds.hyoga.interp(topo[::stride, ::stride])
        interp.hyoga.plot.bedrock_altitude(
            ax=ax, cmap='Topographic', center=False)
        interp.hyoga.plot.surface_altitude_contours(ax=ax)
        interp.hyoga.plot.ice_margin(ax=ax, facecolor='w')
        ax.set_title(f'{res} m')

    # constrain original data axes limits
    axes[0].set_xlim(axes[1].get_xlim())
    axes[0].set_ylim(axes[1].get_ylim())

# show
plt.show()
Total running time of the script: ( 0 minutes 2.225 seconds)