Profile interpolation
Note
Click here to download the full example code
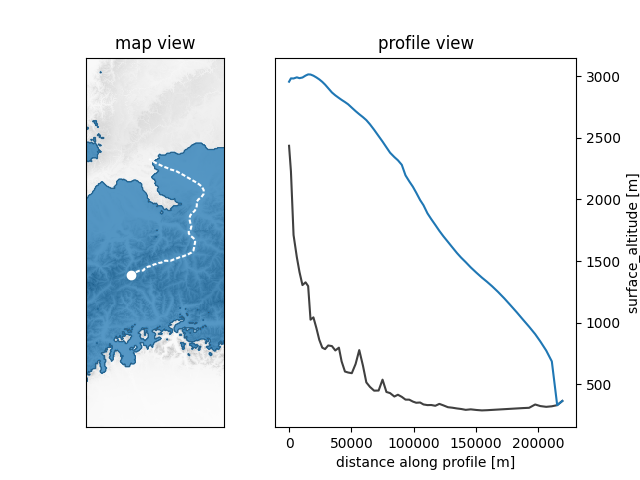
Profile interpolation#
Demonstrate interpolating two-dimensional model output onto a one-dimensional profile defined by x and y coordinates inside a shapefile.
downloading https://raw.githubusercontent.com/juseg/hyoga-data/main/shp/profile.rhine.zip...
import matplotlib.pyplot as plt
import hyoga

# initialize figure
fig, (ax, pfax) = plt.subplots(ncols=2, gridspec_kw=dict(width_ratios=(1, 2)))

# open demo data
with hyoga.open.example('pism.alps.out.2d.nc') as ds:

    # plot 2D model output
    ds.hyoga.plot.bedrock_altitude(ax=ax, center=False)
    ds.hyoga.plot.ice_margin(ax=ax, edgecolor='tab:blue', linewidths=1)
    ds.hyoga.plot.ice_margin(ax=ax, facecolor='tab:blue')

    # interpolate along profile
    ds = ds.hyoga.profile(hyoga.open.example('profile.rhine.shp'))

    # plot profile line in map view
    ax.plot(ds.x, ds.y, color='w', dashes=(2, 1))
    ax.plot(ds.x[0], ds.y[0], 'wo')

    # plot bedrock and surface profiles
    ds.hyoga.getvar('bedrock_altitude').plot(ax=pfax, color='0.25')
    ds.hyoga.getvar('surface_altitude').plot(ax=pfax, color='tab:blue')

# set map axes properties
ax.set_xlim(425e3, 575e3)
ax.set_ylim(5000e3, 5400e3)
ax.set_title('map view')

# set profile axes properties
pfax.set_title('profile view')
pfax.yaxis.set_label_position("right")
pfax.yaxis.tick_right()

# show
plt.show()
Total running time of the script: ( 0 minutes 0.768 seconds)