Bedrock altitude contours
Note
Click here to download the full example code
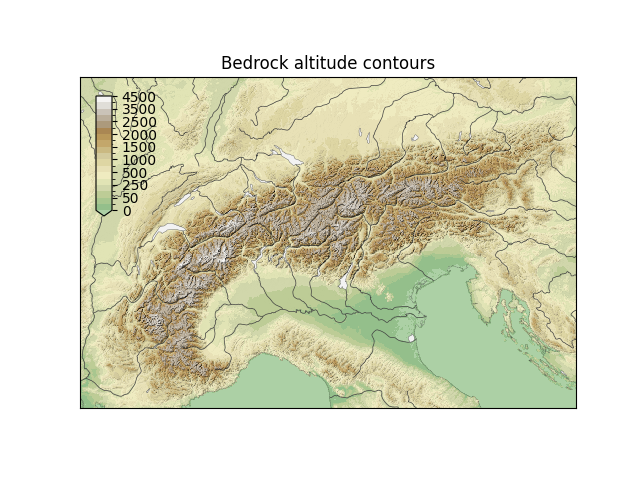
Bedrock altitude contours#
Plot a composite map including bedrock altitude contours, hillshade, and
geographic elements. In absence of a levels argument, the altitude levels
are internally optimized to fit the Topographic colormap.
import matplotlib.pyplot as plt
import hyoga

# initialize figure
ax = plt.subplot()
cax = plt.axes([0.15, 0.55, 0.025, 0.25])

# open demo data
with hyoga.open.example('pism.alps.in.boot.nc') as ds:

    # plot model output
    ds.hyoga.plot.bedrock_altitude_contours(
        ax=ax, cbar_ax=cax, cmap='Topographic', vmin=0)
    ds.hyoga.plot.bedrock_hillshade(ax=ax)

    # add coastline and rivers
    ds.hyoga.plot.natural_earth(ax=ax)

# set axes properties
ax.set_title('Bedrock altitude contours')
cax.set_ylabel('')

# show
plt.show()
Total running time of the script: ( 0 minutes 5.013 seconds)