Hillshade colormaps
Note
Click here to download the full example code
Hillshade colormaps#
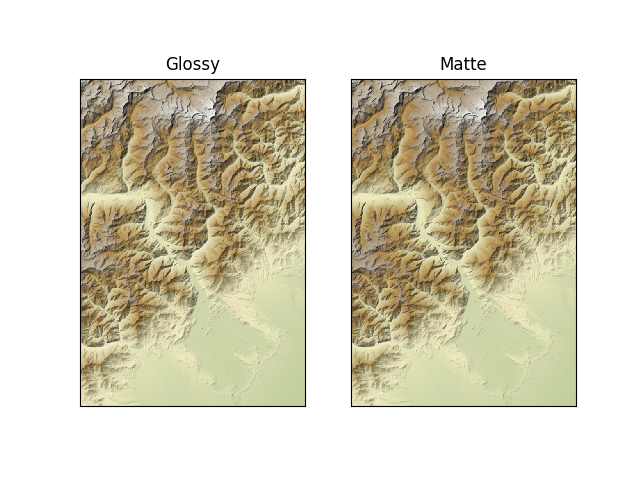
Plot shaded relief map using glossy and matte colormaps.
import matplotlib.pyplot as plt
import hyoga

# initialize figure
fig, axes = plt.subplots(ncols=2)

# open demo data with refined topography
with hyoga.open.example('pism.alps.vis.refined.nc') as ds:
    ds = ds.sel(x=slice(380e3, 435e3))

    # plot bedrock altitude
    for ax in axes:
        ds.hyoga.plot.bedrock_altitude(ax=ax, cmap='Topographic', vmin=0)

    # add hillshades
    ds.hyoga.plot.bedrock_hillshade(ax=axes[0], cmap='Glossy')
    ds.hyoga.plot.bedrock_hillshade(ax=axes[1], cmap='Matte', vmin=0)

# set titles
axes[0].set_title('Glossy')
axes[1].set_title('Matte')

# show
plt.show()
Total running time of the script: ( 0 minutes 0.398 seconds)