Arctic paleoglaciers
Note
Click here to download the full example code
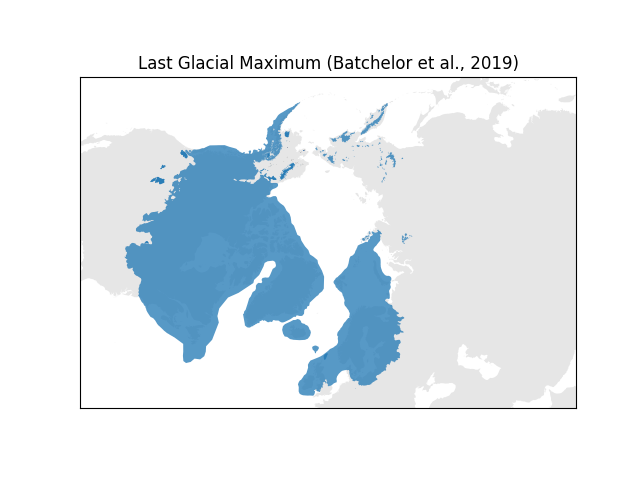
Arctic paleoglaciers#
Plot Batchelor et al. (2019) arctic paleoglaciers as a standalone vector map, using a north polar stereographic coordinate system (https://epsg.io/3995).
downloading https://naturalearth.s3.amazonaws.com/50m_physical/ne_50m_land.zip...
downloading https://osf.io/gzkwc/download...
downloading https://osf.io/xm6tu/download...
downloading https://osf.io/9bjwn/download...
downloading https://osf.io/9yhdv/download...
import matplotlib.pyplot as plt
import hyoga

# plot natural earth land
gdf = hyoga.open.natural_earth('land', scale='50m').to_crs('epsg:3995')
ax = gdf.plot(color='0.9')

# plot paleoglaciers
gdf = hyoga.open.paleoglaciers('bat19').to_crs('epsg:3995')
ax = gdf.plot(ax=ax, alpha=0.75)

# set axes properties
ax.set_title('Last Glacial Maximum (Batchelor et al., 2019)')
ax.xaxis.set_visible(False)
ax.yaxis.set_visible(False)

# reasonable axes limits
ax.set_xlim(-7.2e6, 7.2e6)
ax.set_ylim(-4.8e6, 4.8e6)

# show
plt.show()
Total running time of the script: ( 0 minutes 6.488 seconds)