Scale bars
Note
Click here to download the full example code
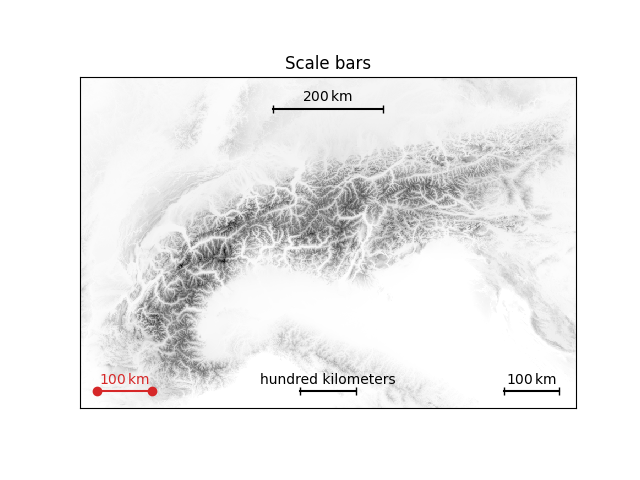
Scale bars#
Plot scale bars with different styles.
import matplotlib.pyplot as plt
import hyoga

# open demo data
with hyoga.open.example('pism.alps.in.boot.nc') as ds:

    # plot model output
    ds.hyoga.plot.bedrock_altitude(vmin=0)

    # custom size
    ds.hyoga.plot.scale_bar(loc='upper center', size=200e3)

    # custom style
    ds.hyoga.plot.scale_bar(loc='lower left', color='tab:red', marker='o')

    # custom label
    ds.hyoga.plot.scale_bar(loc='lower center', label='hundred kilometers')

    # default scale bar
    ds.hyoga.plot.scale_bar()


# set title
plt.title('Scale bars')

# show
plt.show()
Total running time of the script: ( 0 minutes 0.161 seconds)