Bedrock isostasy
Note
Click here to download the full example code
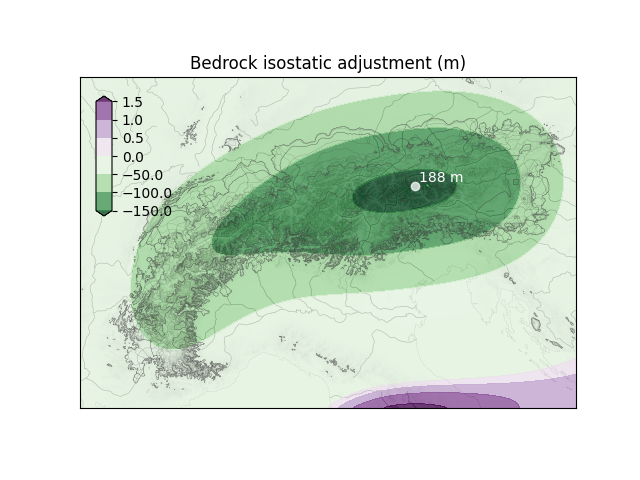
Bedrock isostasy#
Plot a composite map including bedrock altitude, surface altitude contours, bedroc isostatic adjustment relative to a reference topography in a separate model input file, and geographic elements.
downloading https://raw.githubusercontent.com/juseg/hyoga-data/main/pism/pism.alps.in.boot.nc...
import matplotlib.pyplot as plt
import hyoga

# initialize figure
ax = plt.subplot()
cax = plt.axes([0.15, 0.55, 0.025, 0.25])

# open demo data
with hyoga.open.example('pism.alps.out.2d.nc') as ds:

    # compute isostasy using separate boot file
    ds = ds.hyoga.assign_isostasy(hyoga.open.example('pism.alps.in.boot.nc'))

    # plot model output
    ds.hyoga.plot.bedrock_altitude(ax=ax, center=False)
    ds.hyoga.plot.surface_altitude_contours(ax=ax)
    ds.hyoga.plot.bedrock_isostasy(
        ax=ax, cbar_ax=cax, levels=[-150, -100, -50, 0, 0.5, 1, 1.5])
    ds.hyoga.plot.ice_margin(ax=ax)

    # add coastline and rivers
    ds.hyoga.plot.natural_earth(ax=ax)

# set axes properties
cax.set_ylabel('')
ax.set_title('Bedrock isostatic adjustment (m)')

# show
plt.show()
Total running time of the script: ( 0 minutes 5.226 seconds)