Getting started
Page contents
Getting started#
Installing hyoga#
Assuming GeoPandas and xarray are already installed, I recommend installing hyoga using pip:
pip install hyoga
A first plot#
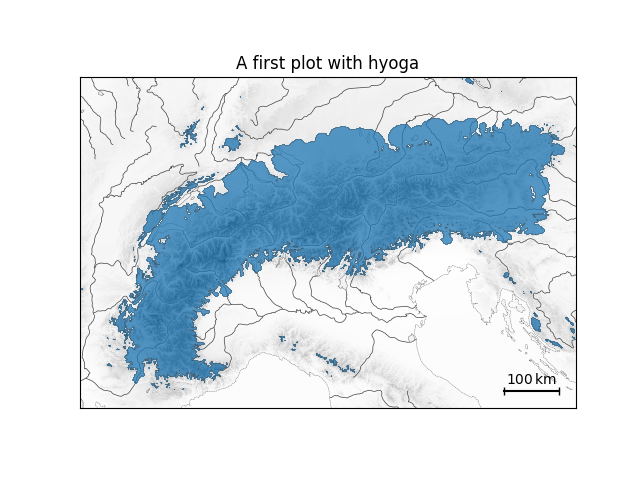
Here is a minimal example that demonstrate hyoga’s core plotting functionality. We open example data and plot the bedrock altitude, an ice margin contour, and hydrologic features to facilitate orientation.
import matplotlib.pyplot as plt
import hyoga

# plot example data
with hyoga.open.example('pism.alps.out.2d.nc') as ds:
    ds.hyoga.plot.bedrock_altitude(center=False)
    ds.hyoga.plot.ice_margin(facecolor='tab:blue')
    ds.hyoga.plot.natural_earth()
    ds.hyoga.plot.scale_bar()

# set title
plt.title('A first plot with hyoga')
Tip
Hyoga alters matplotlib defaults with its own style choices. However, these choices can always be overridden using matplotlib keyword arguments.
Then what#
Hyoga implements several other methods for Plotting glacier data from any CF-compliant xarray dataset. Assuming you have own results to explore, try replacing the example line with:
import xarray as xr
xr.open_dataset('yourfile.nc')
To make your maps pop, check out pages on Plotting shaded relief, Plotting vector graphics, and Spatial interpolation. For a visual overview of the package capabilities, head directly to the Examples gallery.