Ice margin
Note
Click here to download the full example code
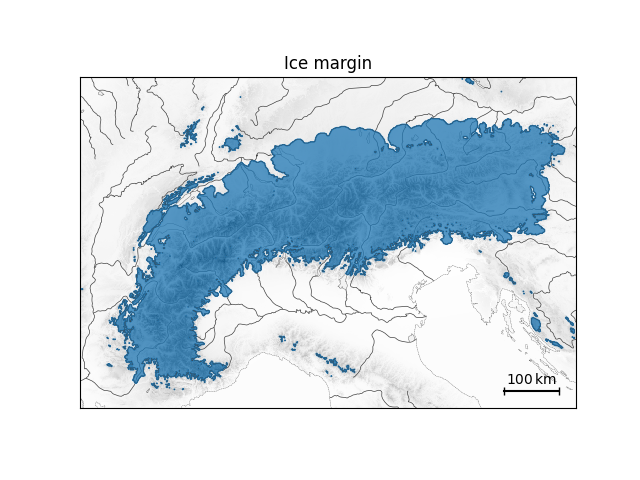
Ice margin#
Plot a composite map including bedrock altitude, an ice margin contour, a half-transparent filled interior, and geographic elements.
import matplotlib.pyplot as plt
import hyoga

# open demo data
with hyoga.open.example('pism.alps.out.2d.nc') as ds:

    # plot model output
    ds.hyoga.plot.bedrock_altitude(cmap='Greys', center=False)
    ds.hyoga.plot.ice_margin(edgecolor='tab:blue', linewidths=1)
    ds.hyoga.plot.ice_margin(facecolor='tab:blue')

    # add coastline and rivers
    ax = ds.hyoga.plot.natural_earth()

    # add scale bar
    ds.hyoga.plot.scale_bar()

# set title
ax.set_title('Ice margin')

# show
plt.show()
Total running time of the script: ( 0 minutes 4.485 seconds)